The monthly GEO report: three numbers for your boss
A monthly GEO report needs three numbers (mention rate, citation rate, share of voice) each with its delta, plus source mix and a changes column. A one-page copyable skeleton, annotated cell by cell.
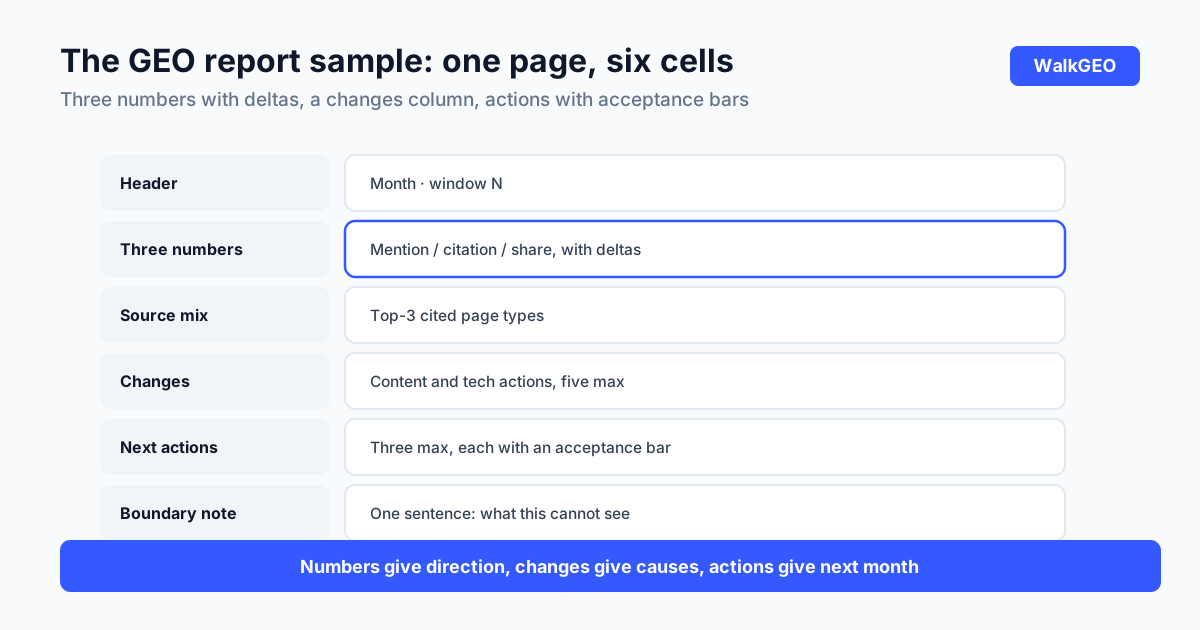
The monthly GEO report, finished product first. One page, six cells:
| Cell | Content | How to fill it |
|---|---|---|
| Header | Month, observation-window number | Windows align to four weeks; write "window N" |
| Three numbers | Mention rate / citation rate / share of voice | Each with its month-over-month delta |
| Source mix | Top-3 cited page types | Which page type is winning |
| Changes this month | Content and technical actions, ≤5 | The only thread that explains swings |
| Next actions | ≤3 | Each with an acceptance bar |
| Boundary note | What this report can't see | One sentence, prevents misreads |
Six cells, a ten-minute presentation. Cell-by-cell notes follow, including the questions your boss will ask about each.
The three numbers: how to compute, what counts as good
The header first: beyond the month, write the window number; window N covering weeks N through N+3. That number is the report's coordinate system; every delta is window-over-window, and writing it down stops the boss from comparing this window against an arbitrary month.
Mention rate: the share of question-set readings where your brand appears. Denominator is the frozen set; numerator counts any appearance, link or not. It answers "does AI know you exist". A worked example: twenty questions across four engines is eighty readings; thirty-two mention you, so 40%. The number means nothing alone: the meaning is the delta. Last window 30%, this window 40%; which ten questions moved can be named one by one. "Which ones rose?" The answer lives in the weekly log, not the report; the report gives direction, the record gives detail.
Citation rate: the share of readings where an answer links to your page. It answers "is the material safe to lift". Same example: twelve of eighty readings link out, so 15%. Expect the sharpest questioning here; prepare two sentences in advance: one explaining the delta (which pages shipped, which questions moved), one stating the next move (from the source-mix cell). High mentions with low citations is the most common shape; the prescription is more citable material, not more exposure. Both low: check the gate before the material, and don't present an attribution yet.
Share of voice: your appearances versus competitors across the same questions. The simplest algorithm: per question, count appearances for you and each competitor, aggregate monthly. This number provokes emotion, especially from the bottom. Attach two constraints when presenting: share moves slowly, one or two points a month is noise; and the competitor list must stay fixed; change the list and every number resets. When the boss compares it against marketing's brand-share figures, the boundary note steps in: share inside AI answers and share bought through advertising are not the same market.
The three numbers form a funnel: awareness first, material selection second, position in the candidate set last. Normal causation runs mention, then citation, then share. Citations rising while mentions don't? Check whether the scoring changed. Share moving faster than mentions? Your competitor list probably needs updating. The funnel's order tells you which number is broken: far more useful than staring at each in isolation.
Source mix and the changes column
Source mix records what the winners look like: spec-comparison pages, listicles, FAQ pages, whichever type keeps getting cited. It translates "citation rate rose" into "comparison pages are winning", and next month's material action grows straight out of this cell.
Each frequent-winner type comes with a move. Spec pages winning means buyers are comparing: build the line-by-line against your top competitors. Listicles winning means buyers want a map: publish a category overview and try to get into other people's lists. FAQ pages winning means buyers ask small questions: move the ten most-repeated support questions onto a page. Source mix connects to actions; that's why it's worth more than the raw citation count.
The changes column logs what you did: published what, edited which page, touched crawler rules, five lines maximum. When the boss asks "why did it rise", the answer is found here; swings caused by competitors get flagged "not our move" in the same column. A report without a changes column never reconciles numbers with causes.
Next actions and the boundary note
Next actions: three maximum, each with an acceptance bar. "Strengthen content" fails the bar; "publish an X-versus-Y spec comparison, re-test that question's citation slot next week" passes. The difference is verifiability: the first can't be judged right or wrong at month-end, the second gets answered by one re-test. More than three actions means the changes column wasn't triaged; triage first, then commit.
The acceptance bar builds a habit too: an action written into the report is a promise to account for it on the same page next month. Write too many unaccountable actions and the report's credibility is self-dismantled. Write fewer, never unwitnessable.
The boundary note in one line: write down what this report can't see. Three recurring examples: engine answers fluctuate, single-week movement isn't a conclusion; engines outside the monitored list (regional, emerging) don't enter the numbers; competitors' spend and actions have no public data, so share shifts aren't all your doing or theirs. The note prevents misreads: the boss treating noise as trend does more damage to future decisions than an ugly number ever does. "Citation rate rose 3 points this month, within sampling fluctuation; direction pending next window" saves you a month of explaining.
The weekly-to-monthly rhythm
The report isn't written in a rush at month-end; it rolls up from four weekly logs. The log records: every question, every engine, every grade (absent, named, cited, rival-linked), fixed weekly hour, thirty minutes. The log's table is five columns (week, question, engine, grade, source) plus a sixth, "changes this week", kept beside the table, one line per change. At month-end, thirty minutes to aggregate: four weeks into three numbers, changes merged and deduped, actions picked from the four-week comparison. A two-hour monthly process is what survives month after month; a design that takes longer gets cut by its own operator.
Another thing that keeps the rhythm: fixed format. The six cells' order, the row counts, the delta notation; all locked. Month-end filling becomes transcription, and judgment goes into reading the numbers, not formatting the page. Change the format monthly and your readers relearn how to read your report every time.
Window alignment follows the four-week cadence from the GEO timeline: deltas are window-over-window, never any-two-weeks. When a window straddles a holiday or a sales season, publish as usual and note "this window includes the sales peak; traffic swings are outside monitoring scope". Continuity beats explanation.

Where these fields come from
Every field in the template comes from weekly records we actually keep: the four grades and the changes column were established in the citation tracking piece; the source mix is the free self-check's reverse-lookup rolled up monthly. One deliberate design choice: the sample numbers are all blank. An empty table is more honest than a fake example: the fields are real, the numbers are yours to fill. A few windows into running this, one lesson held: the more concrete the changes column, the easier the report writes itself. Attribution is a byproduct of record-keeping, not a month-end act of memory.
The question we hear most: "why not just buy a tool?" Because of sequence. Hand-fill for two months and you'll know exactly what you want the tool to take over; batch probing, attribution alignment, trend charting. Buy with that list and everything you buy is used; skip the hand-filling and you'll use three features of the fifteen you paid for, the three that cost the most.
FAQ
Which number does the boss look at first?
Citation rate. Mentions measure awareness, share of voice measures the field, citation rate says "the answer links to your page": closest to the business. Present in that order: give the citation delta first, then explain awareness and field as background. The boss's first question is usually the one you pre-answered with "so what".
Can I compute these three without a tool?
Yes. Test a frozen question set engine by engine: count appearances for mention rate, linked appearances for citation rate, side-by-side appearances against competitors for share of voice. Thirty minutes a week, four rounds a month, a spreadsheet is enough. Tools buy scale and attribution, not the feasibility of the three numbers.
What if the numbers look bad?
Send it anyway, with an explanation and an action. The report's value is continuity; skipping a month breaks every window you've built. An ugly number with an honest attribution and a next-month action builds more trust than a pretty number with no provenance. Bosses trust trend judgment, not a single month's score. Two ugly windows in a row with a clear attribution is a direction problem; the actions column should show structural changes, not "try harder".
How do the monthly report and the weekly log relate?
The weekly log is raw material; the monthly report is the finished product. The log records: every question, every engine, every grade. The report judges; four weeks rolled into three deltas, aligned with changes, plus next actions. Skip the log and the numbers have no provenance; skip the report and the boss never sees a direction. Log first, report second; skipping a level builds on nothing.
The six-cell template is ready to copy. On the first working day of next month, fill it and send it. Send it when the numbers are ugly, boundary note included; three consecutive months and you hold something most teams don't: a trend line aligned with your own changes. The three numbers compute and aggregate weekly in WalkGEO's monitoring line: pricing has the entry. Hand-fill for two months before deciding on tools; keep that order.
Done reading? Run the same audit on your own site
Sign up, then let the agent scan every page and hand you a prioritized fix list. Your first audit is free.
Run a free site audit