The GEO Paper Explained: Where the 40% Visibility Claim Comes From
The "up to 40%" in the GEO paper is no promise but the largest relative gain under a specific metric, methods, and conditions. A line-by-line read shows where it holds and where it fails.
"Visibility up 40%" is the most-quoted, least-checked number in GEO proposals: vendors drop it into pitch decks as a performance promise and readers get half a sentence with every condition stripped out. The original GEO paper (Aggarwal et al., KDD 2024, arXiv:2311.09735) instead gave generative engine optimization its first systematic definition, nine reproducible rewriting methods, and a public benchmark, GEO-bench; that 40% is the largest relative improvement it observed under a specific metric, with specific methods, under specific conditions, neither an industry average nor a guarantee. Putting it back into that context is the only sound way into the paper.
What the paper actually built
Published at KDD 2024 as "GEO: Generative Engine Optimization," with six authors from Princeton University, IIT Delhi, and independent researchers, the preprint arXiv:2311.09735 has v1 dated 16 November 2023 and v3 dated 28 June 2024; the conference version appeared at the 30th ACM SIGKDD in Barcelona, 25–29 August 2024 (DOI 10.1145/3637528.3671900). It redefines visibility for generated answers, where a model writes one paragraph and folds sources into it, a shift what GEO is covers at length. GEO-bench, per the introduction, is "a benchmark consisting of 10000 queries from diverse domains and sources, adapted for generative engines," which made citability a reproducible experiment rather than competing anecdotes. Nine concrete rewrite operations follow, from adding citations, quotations, and statistics to fluency optimization, easier wording, keyword stuffing, and a more authoritative tone.
Visibility is measured two ways. Position-Adjusted Word Count folds the words cited from a source together with where they appear in the answer, capturing how much of the answer you occupy and how near the top, not clicks or rank. Subjective Impression combines relevance, a citation's influence on the query, likelihood a user clicks it, and diversity of material into one score, rated by GPT-3.5 in a G-Eval-style form and normalized; it is a model standing in for human judgment, not real users buying. Together they fence off the result: the paper measures how much you get cited and how a model rates it, not customer acquisition. The GEO metrics glossary spells the terms out.
So what, exactly, does that 40% measure?
Pin the definition down first: 40% is the largest relative improvement the paper observed, on a specific metric, with specific methods, under specific conditions, against an unoptimized baseline; it is neither an average nor a performance promise. Every argument that follows is about those qualifiers.
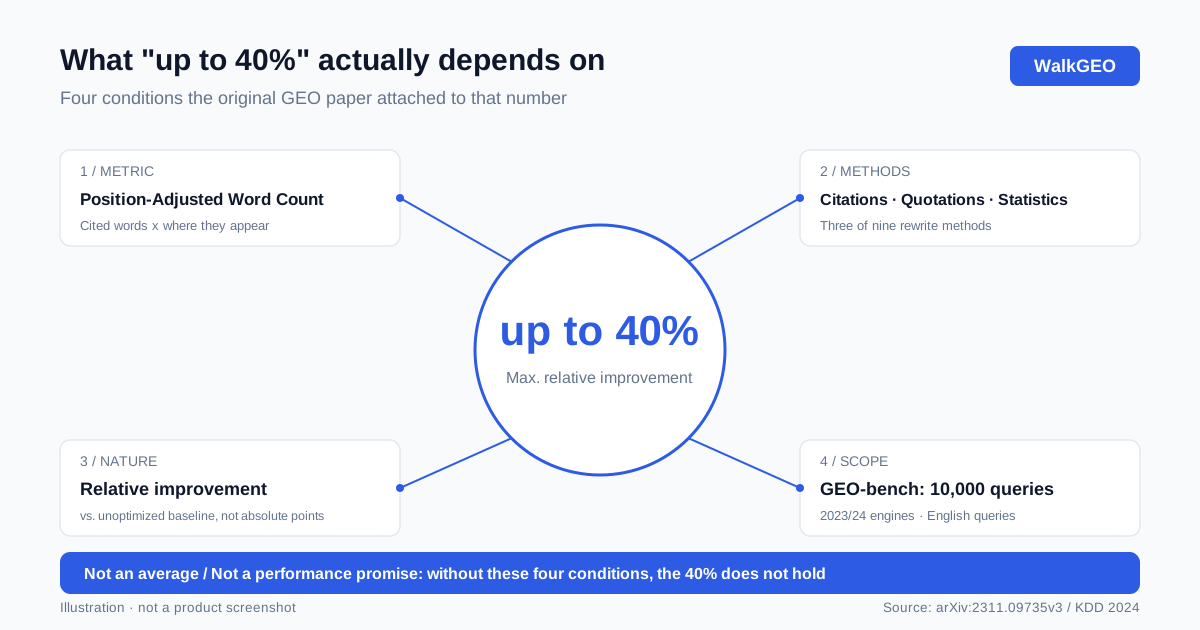
The abstract reads "Through rigorous evaluation, we demonstrate that GEO can boost visibility by up to 40% in generative engine responses"; the introduction credits citations, quotations, and statistics with "an increase of over 40% across various queries"; on Perplexity.ai the paper reports "visibility improvements up to 37%." Three figures, one set of experiments, none saying "on average."
In the results section, Cite Sources, Quotation Addition, and Statistics Addition produced 30–40% relative improvement on Position-Adjusted Word Count and 15–30% on Subjective Impression; Fluency Optimization and Easy-to-Understand also landed in the 15–30% band; Keyword Stuffing gained almost nothing and a more Authoritative tone no significant gain. The quoted 40% is the top of a 30–40% range, on one metric, for three methods only.
| Method | Position-Adjusted Word Count | Subjective Impression |
|---|---|---|
| Cite sources / add quotations / add statistics | 30–40% vs. unoptimized baseline | 15–30% vs. unoptimized baseline |
| Fluency optimization / easier to understand | 15–30% | 15–30% |
| Keyword stuffing | almost no gain | almost no gain |
| More authoritative tone | no significant gain | no significant gain |
All figures come from Section 4 of arXiv:2311.09735v3, as relative improvements against an unoptimized baseline, not absolute percentage points.
"Relative improvement" compares content against itself before any GEO rewrite, a ratio of after to before on one metric, not growth from zero, not a comparison with a competitor, and not an absolute "10% to 50%" scale. The table grouping sources by original search rank makes the dependence plain: sources at rank 5 gained +115.1%, +99.7%, and +97.9% from the three methods, while rank-1 sources went negative at -30.3%, -22.9%, and -20.6%. The same methods pull a low-ranked source forward and can push an already-first source partly out of the answer. That trade-off is the one in how AI picks sources.
Where the finding travels, and where it stops
Strip away the misquoting and a solid judgment remains, but only with its limits attached. What has held up in practice are the citation, quotation, and statistics additions plus readability rewrites that shorten sentences and explain jargon, each adding a fact that can be lifted whole into an answer and still carry its source. The paper's 30–40% and 15–30% follow those facts, not a writing style, which is the path in how to write citable content. By contrast keyword stuffing and a more authoritative tone gained nothing significant, exactly what many "GEO services" sell; the black-hat GEO red flags beside the results show the experiment ruled on them in 2024.
The limits are real. Experiments ran on 2023/2024 generative engines, one a retrieval-plus-generation pipeline the authors built and one the real product Perplexity.ai; queries were English, drawn from a fixed set of 10,000 GEO-bench queries and a fixed source pool; both metrics were model-scored, not real user behavior. There is no Chinese engine ecosystem, no click or purchase data, and no version of today's engines, so the paper guides which rewrites to attempt but cannot forecast next quarter's traffic. The authors draw their own circle: "the efficacy of these strategies varies across domains, underscoring the need for domain-specific optimization methods." Quote that beside the 40% and the account is complete; quote only the first half and the misreading has begun.
How one misreading got corrected
Before writing this we opened the v3 full text and checked it line by line, to see what that 40% looks like on the page. What we met first was not the paper but a second-hand sentence, rewritten and copied everywhere: the abstract's "boost visibility by up to 40%" had become "visibility improves 40% on average" and one step further "add citations and you gain 40%." From "up to" to "on average," from "an observed improvement" to "add and you gain," one sentence lost two qualifiers, a ceiling becoming a mean, an observation a guarantee. This is not a confessional story about our own mistake; it is a misreading you can reproduce by setting the original beside the rewrite, and the lesson sits on that one concrete sentence.
The check gave these articles a concrete writing rule: any experimental figure must appear with its metric, its methods, its baseline, and qualifiers like "up to" and "relative." The blog plan already carried a broader standing rule: no promise that AI will cite you, and no unsourced lift percentages. Both govern the shape of a sentence rather than anyone's memory, so a lone percentage has nowhere to land. We also rewrote a page of our own copy along the paper's lines, replacing "industry-leading" and "proven results" with checkable facts and sources. To be plain: we have no reusable effect number and no before-and-after measurement, so this records the rewrite and claims no lift. A library devoted to "don't turn numbers into promises" is the last place to invent one. Back to you: when a GEO promise carries a percentage, ask what baseline it used, what metric, and on which engine. If the three answers do not come, the number is rhetoric. Engines pick facts they can verify; hold the person selling you a conclusion to the same standard.
Common questions
Where exactly does the 40% in the GEO paper come from?
The paper's abstract reads "GEO can boost visibility by up to 40% in generative engine responses"; the introduction ties this to adding citations, quotations, and statistics, and the results section places those three methods at 30–40% relative improvement on the Position-Adjusted Word Count metric against an unoptimized baseline. The figure comes from arXiv:2311.09735v3 and the KDD 2024 version, and it never travels without its metric, its methods, and its baseline.
Will adding one citation really lift my visibility by 40%?
That is a relative improvement misread as a causal guarantee. Keyword stuffing yielded almost no gain and a more authoritative tone no significant gain, so the trigger is far narrower than "add one citation."
Is the 40% a percentage-point figure or a relative one?
Relative, not absolute percentage points. The paper reports relative improvement, a ratio of before to after on one metric, not "visibility going from 10% to 50%." In the table that groups sources by their original search rank, sources starting at rank 5 improved by close to or over 100%, while rank-1 sources went negative, which is exactly what a baseline-dependent relative measure looks like.
Can I put this number into a client proposal?
Not as a performance promise, at least. It is an experimental result observed on 2023/2024 generative engines, English queries, a fixed GEO-bench set of queries and sources, and model-scored metrics; the paper itself states that strategy efficacy varies across domains. Turning it into "a guaranteed 40% lift" drops both the experimental conditions and the no-performance-promise rule.
What year is the paper from, and where was it published?
Published in 2024 at KDD 2024, the 30th ACM SIGKDD Conference on Knowledge Discovery and Data Mining, held 25–29 August in Barcelona, DOI 10.1145/3637528.3671900. The preprint arXiv:2311.09735 has v1 dated 16 November 2023 and v3 dated 28 June 2024, with authors from Princeton University, IIT Delhi, and independent researchers.
Loop back to the definition pinned down earlier: 40% is the largest relative improvement the paper observed, on a specific metric, with specific methods, under specific conditions, against an unoptimized baseline, neither an average nor a performance promise. Next time a lone percentage shows up in a proposal, do not ask first whether it can be delivered; ask for its baseline, its metric, and its test engine, and stop if the three are missing. WalkGEO's writing rules already forbid turning a figure into a promise; make it routine with the weekly review routine, and see pricing when you need visibility readings collected week by week.
Done reading? Run the same audit on your own site
Sign up, then let the agent scan every page and hand you a prioritized fix list. Your first audit is free.
Run a free site audit