GEO metrics explained: visibility rate, Top-3 share, citation rate
GEO metrics need a fixed counting method before any number means anything. Five metric cards with question, numerator, denominator, and exclusion rules, plus the real math our own product runs.
Fix the counting method first; then talk numbers. The word "visible" yields at least three results inside a single monitoring run: mentioned in the answer, cited with your link, or ranked near the top of a recommendation slot. Each counting method stands on its own; blended into one curve, the trend means nothing. You have probably watched two vendors report on the same brand, one claiming forty percent visibility and the other under ten, both computed correctly, both meaningless side by side because the denominators were never the same thing. This article turns five common GEO metrics into five cards, each fixing the question, numerator, denominator, and exclusion rules; copy them into your log and they work. Each card also notes the real math our product runs, including the slots we deliberately do not fill, so you can judge for yourself how far our numbers reach.
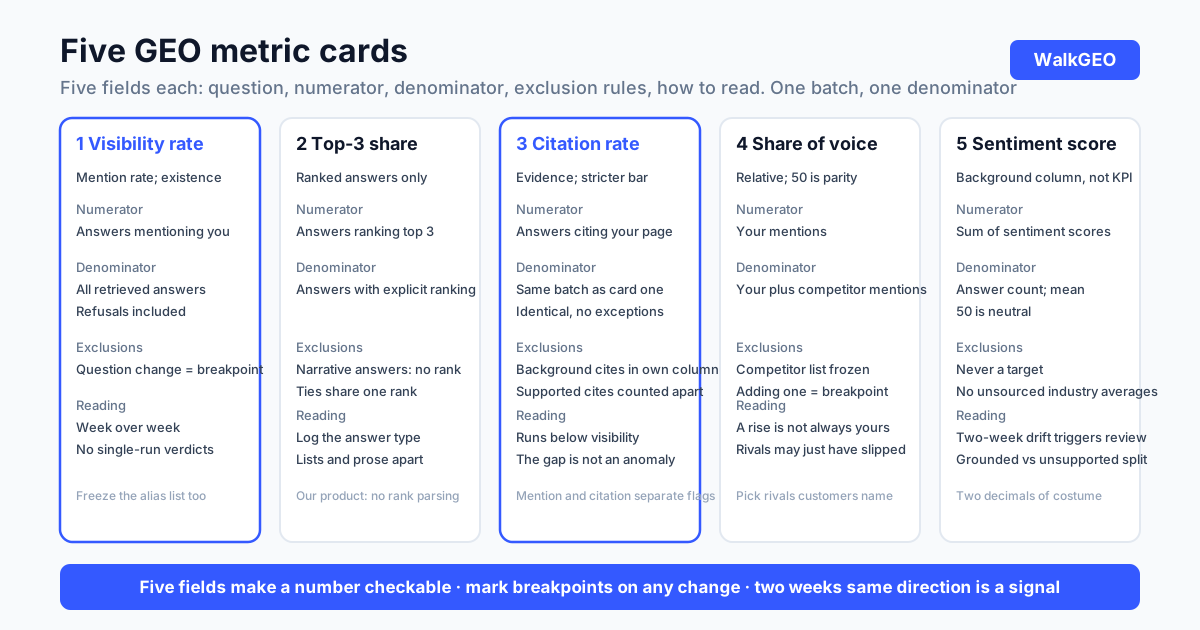
What a usable metric card looks like
Five fields: metric name, the question that measures it, numerator, denominator, exclusion rules. Missing any field and the number slides back into vibes. Claim forty percent visibility and a reviewer asks whose answers are in the denominator, whether refusals count, which day the count closes; three unanswered questions and the forty percent is rhetoric. With all five fields filled, anyone holding a different number can rerun the same card and locate the gap: was the numerator loose, or the denominator wide?
That same card is your ruler for auditing vendor reports. Every percentage in a monthly report should decompose into these five fields; anything that does not decompose gets treated as prose. The five cards below share one format. The first is walked through in detail; the rest give the fields straight, in the same layout, ready to copy.
Card one: visibility rate (mention rate)
Definition: answers that mention you, divided by all retrieved answers in the batch, times one hundred. One sentence, quotable and checkable.
- Numerator: any mention counts, regardless of role. Recommended, mentioned in passing, even criticized, all count as mentions. Role and tone belong to two other cards; keep judgment out of the numerator. Do brand aliases count? Yes, once the alias list is fixed and frozen alongside the question set. A drifting alias list makes a drifting numerator.
- Denominator: all retrieved answers in the batch. Our real rule counts everything, refusals and failed probes included. The benefit is strict comparability across a batch with no human filtering; the cost is that occasional engine failures dilute the reading, which is why readings are taken weekly and no conclusion is drawn from a single run. A purely arithmetic illustration: seven mentions across twenty answers is thirty-five percent; exclude two engine failures and it becomes seven over eighteen, thirty-nine percent. Both are legitimate numbers; the difference is the rule, and curves under different rules do not splice.
- Exclusion rules: freeze the question set. Change a question and you have changed the denominator; the curves on either side do not connect. The freezing discipline, including when adding questions is legitimate, is laid out in our prompt set design guide.
- Implementation: the WalkGEO overview computes this formula separately for each entity, one visibility rate for you and one per competitor, all over the same batch of answers. No computing your rate on full data while competitors get filtered data.
Card two: Top-1 and Top-3 share
Rank metrics only count inside answers with explicit ordering. List-type and recommendation-type answers have slots; record Top 1 or Top 3 there. Narrative answers have no ranking, and forcing one is fabrication. Two supplementary rules: ties record the same rank, or degrade to a boolean, made the top three or not; unranked answers fall back to the card-one mention boolean rather than being squeezed into a rank. Log the answer type alongside the number: lists get ranks, narratives get mentions, and mixing them in one column erases the distinction.
An honest disclosure: our product currently counts mentions and citations, not in-answer positions. The Top-3 card is a manual-check tool in our workflow, filled in while reviewing list-type answers one by one. If you add this card, declare which answer types it covers, and put that boundary into the exclusion-rules field like any other.
Card three: citation rate and supported citations
Definition: answers that attach a citation to your pages, divided by the same batch of retrieved answers, times one hundred.
- The denominator matches card one exactly, the same batch of answers. Change it and the comparison between the two rates breaks.
- A citation is not automatically a supporting citation. A link attached as background and a link the key claim actually rests on are two strengths of evidence. Keep two columns: citations, and citations supporting the conclusion. The second column is judged by hand with two tests: does the answer's key claim land on your page, and does the answer still stand if the link is removed. Slow is fine; this column is the feedback loop for your material.
- Our real implementation: mention and citation are two independent boolean flags, each producing its own rate, never merged or converted. The citation rate normally runs below the visibility rate; the bar is stricter, and that gap is not an anomaly.
- For which answers carry citations and how to read citation decay, our citation tracking guide covers snapshots versus time series; its reading rules transfer straight into your weekly sheet.
Card four: share of voice
Definition: your mention count, divided by the sum of your and your competitors' mentions, times one hundred.
The denominator contains only the competitors you have bound. Adding one competitor moves every historical reading, so the competitor list freezes just like the question set. Choosing competitors deserves care: pick the alternatives customers actually name, not the internal rival you have benchmarked for a year; when unsure, the names that recur in sales conversations are the list. Reading the number is simple: fifty is the parity line, and our system badges that line; draw the same line in your own sheet. Share of voice measures relative position, so a rise does not mean you improved; your competitor may simply have weakened, and a good report says both sentences. For questions where competitors take the slot, our brand mention gap guide walks the attribution and the page to build in response.
Card five: sentiment score
Each answer gets a sentiment score; the metric is the arithmetic mean, with fifty as neutral, which is exactly how our implementation works. This card stays a background column, never a KPI. Sentiment can be gamed: make it a target and someone will prompt engines into producing praise, polluting your own baseline. Watch out for the other trick, packaging subjective scoring as spurious precision; a figure like "AI favorability 87.3" carries two decimal places of costume, and industry average scores of unknown origin stay out of your sheet. The legitimate use is anomaly detection: a two-week downward drift triggers a pass through the records, separating grounded negatives from unsupported ones, because the two call for completely different responses. How to log reputation and fold it into reporting is laid out in our brand sentiment guide.
The five cards, merged into one weekly sheet
Individual cards work; a single sheet reads better in a report. Seven columns: metric, this week, last week, change, breakpoints, notes, action. The change column holds direction and magnitude only. The breakpoint column marks any week where a denominator moved. Notes carry new exclusion-rule events. The action column is for decisions; writing "keep observing" is as legitimate as any percentage, and it proves the week's noise did not steer you.
| Metric | This week | Last week | Breakpoint | Action |
|---|---|---|---|---|
| Visibility rate | direction and size | last reading | none | keep observing |
| Citation rate | same | same | none | fill supported-citation column |
| Top-3 share | list-type questions only | same | answer type changed | recheck positions |
| Share of voice | same | same | competitor added | restate the baseline |
| Sentiment score | background | same | none | review negative records |
The template ships empty on purpose, because the numbers must come from your own probing; copying someone else's numbers is meaningless. What the template carries is the logic between cells: every figure either decomposes back into the five-field card or carries a breakpoint marker, and a figure that does neither stays off the sheet.
Three rules that govern all five cards
- Freeze the denominator. Question set, engine list, competitor list: frozen. Touch any one of them and mark a breakpoint in the sheet; do not compare across it. A breakpoint is an honest mark, not a failure; splicing two readings under different rules into one line is the self-deception.
- Read weekly. Our scheduled probes run every two days; a weekly manual round is enough for self-testing. Judge week over week, and treat two consecutive weeks in the same direction as the signal threshold. Most single-week movement is sampling noise, and acting on it changes nothing but your own records.
- Write exclusion rules on the spot. What counts and what does not goes into the card when you build it, not after the first dispute. Four weeks later you have to honor these notes, and so does everyone else on the team; that is the only reason the field exists.
A real incident: when our own numbers went wrong
Our overview once showed competitor visibility at zero across the board after a release. The discovery came from routine checking: an entire column of zeros is nearly impossible in any live market, because even at minimal share, long-tail questions should produce scattered mentions. The root cause sat in the aggregation layer, which preferred the daily snapshot, and the snapshot lacked competitor fields; missing fields were rendered as zero instead of as missing data. The fix had two layers: preserve missing fields rather than zeroing them, and fall back to raw probe data for the computation. Nothing in the formulas changed; what changed was the exclusion rule for missing data.
The lesson for you fits in one sentence: when a number looks too tidy, a full column of zeros, a full column of hundreds, two decimal places of precision, suspect the statistics before the market. A metric system is not reliable because its formulas are sophisticated; it is reliable because every edge case, missing data, refusals, failed runs, has a written rule. The same test applies to vendor reports: ask whether a zero was measured or filled in for missing data. A peer answers in seconds; hesitation tells you what the report is worth.
Frequently asked questions
Why do two tools report different visibility rates for the same brand?
Almost always a different denominator. Some exclude refusals before computing, some count failed engine calls in the total, some only count answers with web search on. Nobody is wrong; the denominators differ. Before trusting any number, ask three things: what is in the denominator, are refusals counted, and on which day is the count taken. Without those three answers, the numbers cannot be compared.
Which should I watch first, mention rate or citation rate?
Mention rate. A mention is an existence question: are you in the consideration set at all. A citation is an evidence question: did the answer trust your page enough to attach it. The citation bar is stricter, so the number runs lower and swings more. Chase mentions first; once your material is right, citations follow. Reversing the order tends to produce cosmetic citation tweaks instead of substance.
Do refusals and failed probes count in the denominator?
Ours counts everything. Keeping the denominator complete makes every batch strictly comparable with no human filtering; the cost is that occasional engine failures dilute the reading. You can exclude failures instead. Either rule is legitimate; what matters is writing it down and not touching it for four weeks.
How often should I test to see a trend?
Fixed rhythm matters more than frequency. Our scheduled probes run automatically every two days; a weekly manual round is enough. What cannot move is the trio of time slot, question set, and engines. Read week over week, not run over run; two consecutive weeks in the same direction is a signal, a single-week wiggle is a note, not a task.
Five cards, ready to copy. They connect with the broader framework in how to measure AI visibility and the starting path in free AI visibility check: one sets the frame, the other produces your first round of data. Whether you need a tool is a volume question: under fifty questions, a manual sheet holds; beyond that, hand the frozen questions to scheduled probes. WalkGEO computes all five cards from them, our weekly routine is copy-ready, and pricing has the entry. The counting method goes on paper first; only then do the numbers earn a voice.
Done reading? Run the same audit on your own site
Sign up, then let the agent scan every page and hand you a prioritized fix list. Your first audit is free.
Run a free site audit