AI Referral Traffic and Attribution: What You Can and Can't Claim
Most of AI's influence happens inside the answer, not in your access logs. Count what you can (referrals, brand searches, sales feedback), observe the rest, and keep correlation out of contracts.
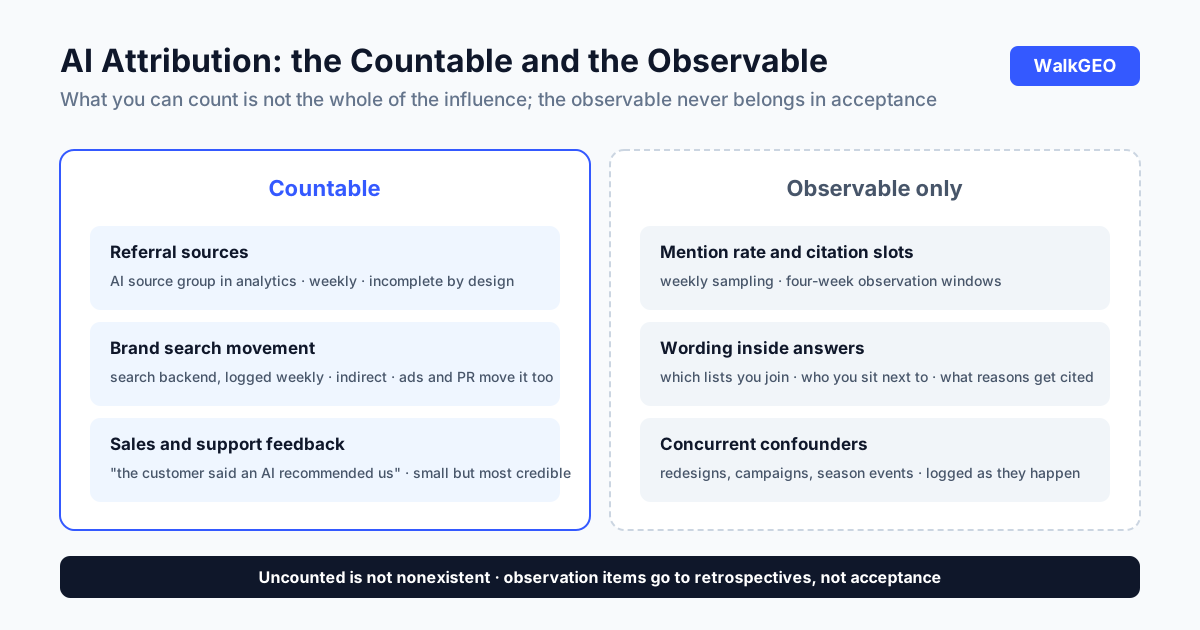
Most of AI's influence happens inside the answer, not in your access logs: the user gets the conclusion from the engine, clicks through sometimes, and sometimes just leaves. So the first move in attribution is not installing a tool; it is separating two things. Referral sources, brand-search volume, and sales feedback can be counted. Mention rates, citation slots, and the wording inside answers can only be observed. Treating the observable as an acceptance metric, or treating the uncountable as nonexistent, are the two most common errors on this road.
One row of backend data: 9 impressions, 0 clicks
In early November 2026 we read the first batch of Search Console data for our own site: eight English queries, all hitting measurement intent, 9 impressions and 0 clicks combined. In the pure search era that is a bug to investigate; in the AI-answer era it simply puts the situation on the table: users got the answer from the engine, the answer carried us, and no click followed. Zero-click is not a paper concept; it is the first real row of backend data.
That row changed shape two weeks later: the second batch of top queries grew to 63 entries, and the top one became a new article the same day we saw it. The same data first told us influence goes uncounted, then told us observation feeds back into content planning. Both readings are true, and mixing them is exactly how the numbers go wrong.
Where the difficulty comes from: three gaps
The first is behavioral. In the search era users arrive with intent and the behavior chain is complete; in the AI era the answer finishes the task, clickers are the minority, and everyone else sits outside your statistics. The second is sourcing. Some engines route answer links through redirects or parameter handling that never lands in the bucket you expect, so AI source groups undercount by construction. The third is temporal. A user meets you inside an AI today, searches your brand two weeks later, and buys a month after that; a causal chain across three touchpoints cannot be held by any single-point number.
Stack the three gaps and you get the honest conclusion: the true magnitude of AI influence will always exceed what you can count. That is not a tooling defect; the channel's shape determines it. Accept it first, and every later step keeps its bearings. Accepting it is not giving up on measurement; it is switching the target: stop guessing at the total, and make what you can measure accurate, stable, and sustainable. Stable means retesting weekly with the same method; sustainable means the fields and sources still line up three months later. With those two in place your readings can be compared across cycles, and cross-cycle comparison is the ground everything else stands on.
The three countable signals, their methods and limits
| Signal | How to capture | Limit |
|---|---|---|
| Referral sources | Build an AI source group in analytics, review weekly | Incomplete coverage: influence from citations inside answers carries no click |
| Brand search volume | Record brand-query impressions and clicks weekly from the search backend | Indirect: ads, PR, and seasonality all move it |
| Sales and support feedback | Record "the customer said an AI recommended us" as a fixed field, weekly | Small but most credible: closest to the deal, accumulated by hand |
Their value is mutual corroboration, not any single point. Referrals up, brand searches up, and sales hearing customers mention AI: three independent signals pointing the same way is the only state where "AI is doing work" survives scrutiny. One signal alone can always be explained away by some confounder. Mutual corroboration also catches errors: referrals up while brand searches sit flat is not a celebration moment; it usually means parameters landed in the AI bucket wrongly or crawler traffic slipped in, so take the sources apart and check before concluding. The measurement details, like what counts as a valid sample, are laid out in our metrics piece; the two articles work as a pair.
Correlation is not causation, and least of all contract language
Reading a synchronized movement as cause and effect is the deepest pit on this road. Your citation slots improve and brand searches rise, but in the same window you may have redesigned the site, run ads, or caught a seasonal peak, and each explains the same movement as well. What you can do is build an observation window: frozen question set, weekly sampling, four weeks to start, with every concurrent action logged into a confounder table read line by line at interpretation time. The wording of conclusions needs the same restraint: "within the same window, citation rate rose and brand searches rose" survives every word; "GEO drove 30% lead growth" survives no step of questioning.
In procurement this becomes real money. Leads respond to product, pricing, sales motion, and season at once, and binding the longest attribution chain to whichever party owns only the content guarantees a blame exchange at acceptance. Contracts can hold the front-end quantifiable part: weekly-sampled mention and citation rates plus statistical rules fixed beforehand; leads stay an observation item for retrospectives, not acceptance. How that lands on paper, from baseline to exit clauses, is walked through in the ten-clause contract piece.
The confounder table deserves its own word on construction, because it needs only three columns: action, time range, and blast radius. A redesign, a campaign, a promotion, an industry event, anything concurrent goes in, each tagged with the metrics it probably moves. Reading numbers through this table before concluding takes five minutes and blocks most self-deception. The table is easy; the hard part is that nobody remembers what happened concurrently, so it must be logged as actions happen, not remembered at the retrospective.

Common questions
Why is AI referral traffic harder to attribute than search traffic?
A search engine walks the user to your page and Analytics records a sourced session; an AI answer hands over the conclusion, and the user may click nothing. Most of the influence that happens inside AI leaves no row in your analytics tool at all. What you can count is the fraction that clicks through, the movement in brand searches, and feedback from sales, three real signals that still do not add up to the whole.
An AI answer cited my site. Why does my backend show no traffic?
Both happen. The user got what they needed from the answer and never clicked, so that influence is invisible; and some engines route links through redirects or parameters that never land in the expected source bucket. "Cited but no traffic" is the normal state of this channel, so read the trend, not any single day.
Can lead growth be written into a GEO contract as an acceptance metric?
No. Leads respond to product, pricing, sales motion, seasonality, and ad spend all at once; binding the longest attribution chain to whichever party only owns the content guarantees a blame exchange at acceptance. Contracts can hold the front-end, quantifiable part: weekly-sampled mention and citation rates plus statistical rules fixed in advance. Leads stay an observation item for retrospectives, not acceptance.
What can I start today with no tools at all?
A few zero-cost moves. Create an AI source group in your analytics tool, even with just two or three known domains; log brand-search volume weekly in one sheet; ask sales and support to record "the customer said they saw us on an AI" as a standing field, summarized weekly. With those in place your observation has a foundation, and tools are the amplifier that comes later.
Public research offers a direction. Adobe's retail-data reports have tracked AI referral conversion quarter by quarter since 2025, and the directional conclusion holds: the channel moved from converting below non-AI traffic to converting above it. We deliberately quote no percentage here, because each report's industry mix, window, and measurement differ, and lifting one number into your own reporting errs faster than you expect; if you need one, check the current Adobe report's methodology first, then decide which sentence of yours it can actually support.
The boundary of attribution comes down to one sentence: what you can count is always a fraction of AI's influence, the uncounted is not the nonexistent, and the counted is not automatically yours. Stating that boundary plainly makes your reporting more credible than most. The three zero-cost signals start today; when weekly, per-engine sampling outruns manual bandwidth, pricing and the weekly routine cover the hand-off from manual to automated. WalkGEO's own referral observation is still a hand-kept sheet; we trust it first, and amplify it later.
Done reading? Run the same audit on your own site
Sign up, then let the agent scan every page and hand you a prioritized fix list. Your first audit is free.
Run a free site audit